An honest Starlink uptime figure splits time three ways: up, down, and unobserved. The third category is the one most monitoring tools and SLA reports quietly delete, and it is the one that matters most for Starlink fleets, because terminals at sea and at unattended sites regularly pass through periods when nothing could observe them at all. A terminal you could not see is not a terminal that was up, and a report that counts it as up is guessing in your favour.
This guide explains why the three-way split is the only defensible way to report fleet availability, and what else an availability report needs before you put it in front of a customer.
Why is “99.9% uptime” usually a fiction for remote terminals?
Because most monitoring can only distinguish two states, reachable and unreachable, and then has to decide what unreachable means. If the monitoring lives in a cloud and polls the terminal across the internet, an unreachable terminal is ambiguous: the link may be down, the site may have lost power, or the path between the cloud and the site may have failed somewhere that has nothing to do with the terminal. Different tools resolve that ambiguity differently, and the flattering resolution, assume up unless proven down, produces the familiar dashboard where everything is always 99.9%.
That number fails exactly when it matters. A skipper disputes the connectivity bill for a week the vessel was in harbour with shore power off. A customer claims the link was down overnight. If your report cannot distinguish “we recorded it down” from “we could not see it”, you are arguing from a guess.
What does the honest three-way split look like?
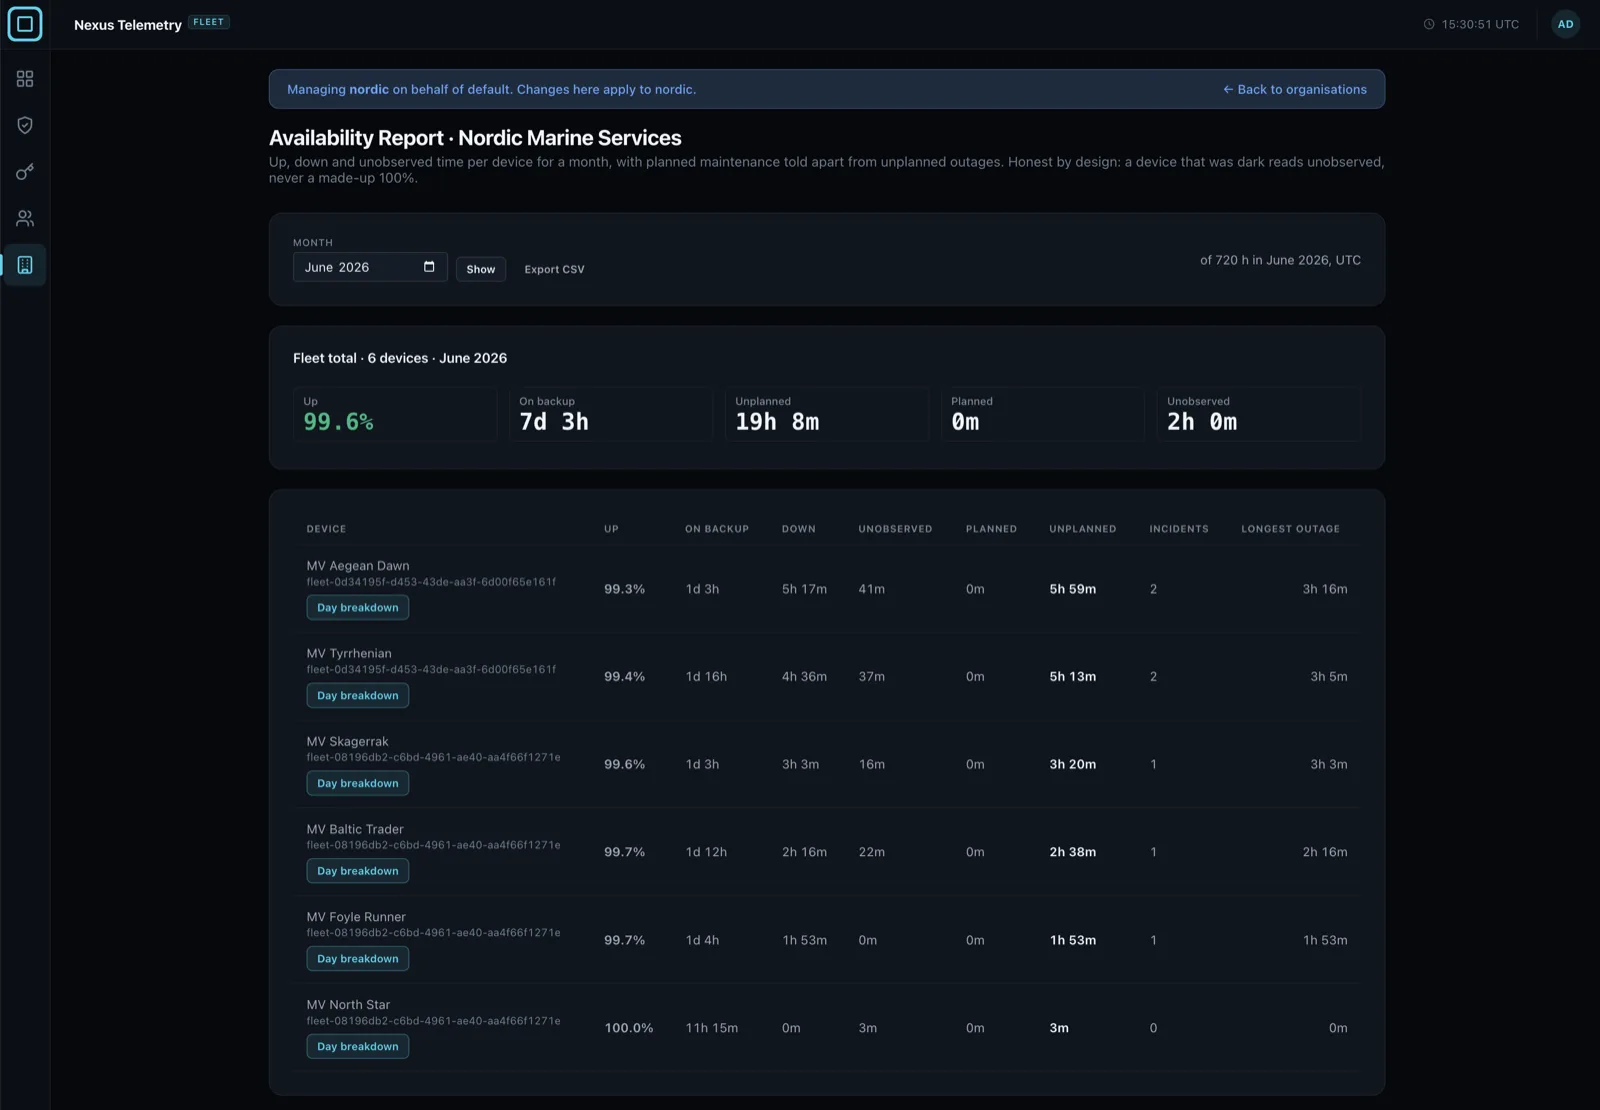
Every hour of the reporting period lands in exactly one bucket. Up means the monitoring observed the terminal and it was healthy. Down means the monitoring observed the terminal, or was present on site, and recorded it unhealthy. Unobserved means nothing was in a position to know, and the report says so instead of inventing a value. A dark device reads unobserved, never a silent 100%.
Two refinements make the split genuinely useful for operations. Downtime should divide into planned and unplanned, because a maintenance window you scheduled is not a failure and should not read as one. And time on a backup link deserves its own count: a vessel that failed over to a secondary connection was up for the crew but degraded for the operation, and a report that shows on-backup hours separately tells you both truths.
In practice the unobserved bucket has a shape you can sanity-check. A powered, always-on site should show minutes a month: a reboot here, an update there. A vessel laid up for the winter, or a construction site with the generator off over the holidays, shows honest days or weeks of it. Anything between those two patterns is information in its own right: sustained unobserved time on a site that should be powered means the monitoring itself needs attention, and a report that surfaces that is telling you something the flattering dashboards structurally cannot.
Why does local collection change the arithmetic?
Because it shrinks the unobserved bucket and hardens the down bucket. A collector on the vessel’s own network observes the terminal directly, so a cloud-path failure between ship and shore no longer blinds the record: the collector keeps recording locally through the outage and reports what it saw once the path returns. What was unobservable from a cloud becomes an observed record of exactly what the terminal did. The unobserved bucket then shrinks to the cases that are genuinely unknowable, such as the site losing power entirely, and even then the record shows precisely when observation stopped and resumed rather than papering over the gap.
This is the reporting model Nexus Telemetry Fleet is built around: a monthly per-device report with the three-way split, planned against unplanned downtime, on-backup hours, a day-by-day drill-down, and export to CSV for the customer file. The design rule underneath it is blunt: the report never invents a value it did not receive.
What should you ask of any availability reporting?
Three questions expose most tools. Ask what the report shows for a device that went dark for a day: if the answer is anything other than an explicit unobserved period, the tool is guessing. Ask whether planned maintenance can be excluded from unplanned downtime without editing history.
And ask where the observation actually happens, because a report is only as honest as the vantage point it was recorded from. Starlink’s documentation states the Telemetry API contains data from online terminals, so a terminal that loses its link is absent from the feed until it returns: for that window, a cloud vantage point records nothing, which is exactly what the unobserved bucket is for. We walk through what the feed carries in Enterprise API vs direct telemetry.
The short version
Report availability in three buckets: up, down, unobserved. Split downtime into planned and unplanned, count on-backup hours separately, and never let a dark device read as healthy. Collect locally so the record survives the outages it exists to describe. If a tool cannot do these things, its uptime figure is a guess wearing a percentage.
Part of Starlink Fleet Monitoring: The Complete Guide. Nexus Telemetry Fleet is built by Liquidbinary Ltd, the developers of one of the first Starlink Enterprise management platforms. Fleet is in early access: get started.