The short answer: the Starlink Enterprise API delivers a compact set of metrics aggregated on a fifteen-second interval per terminal, by Starlink’s own documentation, while the terminal itself broadcasts its full telemetry surface every second on the local network. They are not competing versions of the same data. One is a cloud summary, the other is the source, and a serious fleet operation usually wants both for different jobs.
We say this from an unusual position: we developed and operated one of the first Starlink Enterprise management platforms, in production across thousands of terminals from 2022 to 2025, before building Nexus Telemetry on direct telemetry. What follows is what each layer gives you, drawn from Starlink’s published documentation on one side and the terminal’s local interface on the other.
What does the Enterprise API actually provide?
The Enterprise API provides two distinct things: a management API for the account and a Telemetry API for monitoring data. The distinction matters.
The management API handles the account: service lines, subscriptions, addresses, data usage and pools, router configuration, and reboot commands. This is genuinely valuable and has no local equivalent. Usage against your data plan, billing cycles and provisioning live here and nowhere else.
The Telemetry API is a stream you poll continuously for batches of records. Starlink’s Telemetry API documentation specifies the resolution directly: user terminals and routers aggregate data on a fifteen-second interval before sending it, IP allocation records arrive on at most a five-minute cycle, and telemetry may not be available in every response, so clients keep polling until data returns.
The per-terminal fields are a compact set: downlink and uplink throughput, ping latency averaged to the point of presence, drop rate averaged over the fifteen-second window (measured by pings that Starlink’s documentation notes are prioritised over other traffic, so the average may understate loss on a congested link), a moving-average obstruction percentage, uptime, signal quality as a capped nought-to-one figure, software version, active alert codes, and location as a coarse geospatial cell rather than coordinates. Router records add client counts, byte counters and hop metrics.
The alert codes deserve their own mention. The documented set is genuinely useful for categorising problems: thermal throttling and shutdown, a stuck actuator motor, a mast more than thirty degrees off vertical, obstruction (flagged at 0.27% of time obstructed, or an obstruction map more than 0.5% obstructed), a reboot caused by power loss, and a family of service-state alerts naming exactly why service is disabled: account standing, data quota, unsupported country, moving too fast for the plan. The service-state alerts are account-level knowledge that exists only in this layer. Two documented behaviours to note: an alert triggers if its condition was met at least once in the previous fifteen seconds and persists while active, so a two-second transient surfaces in the alert field for roughly fifteen seconds; and the API is stateless, so polling slower than that can miss it.
What does the API not see?
Everything below the fifteen-second average, and every field it does not carry. There is no obstruction map, only the single percentage. No alignment data, so a dish that repoints itself looks identical to one that has not moved. No power draw, which matters on vessels and battery sites. No satellite count, no boot timings, and no sub-second event record, so a cluster of two-second dropouts that ruins a video call arrives as a slightly elevated fifteen-second average, if it is visible at all.
The same three minutes, cut three ways
Drop rate during a cluster of short outages: the per-second source against a fifteen-second cadence, aggregated two ways.
- Per-second, read at the terminal
- 15-second window, averaged
- 15-second window, sampled
- 1Per-second source: all three outages on record
- 215-second average: a wobble under 25%
- 315-second sample: all three missed
Drop rate is documented as an average over the last fifteen seconds and latency as an average; the fifteen-second interval is documented for every field, but the aggregation method for the rest, throughput included, is not. Values illustrative.
The structural limits matter as much as the missing fields. The feed follows the path between your infrastructure and Starlink’s cloud: if your consumer disconnects, the stream holds its place and catches up on reconnection, within the stream’s documented eight-hour retention. The documentation also warns that the consumer’s position advances on each successful response, so a process that crashes mid-batch will not see the unprocessed entries in its next request. And it states the API contains data from online terminals, so a terminal whose link is down is absent from the feed for that window. The documentation also notes the column set is expected to expand, the alert code mappings can change, and consumers should re-parse the schema on every response, which in practice means your monitoring depends on someone else’s release schedule. We watched that surface evolve for three years; the local telemetry consistently led the cloud feed.
What does direct telemetry provide?
The terminal broadcasts its full state on its own local network, updated every second: throughput, latency, drop rate, the complete obstruction map as well as the percentage, alignment including actual versus intended pointing, power draw, satellite counts, boot and outage timings, subsystem health and the event record. This layer is not a workaround: Starlink’s own Telemetry API FAQ answers “Is there a local API on the device?” with yes, a local gRPC API for diagnostic data, and points to the SpaceX GitHub for its documentation. Because it is read locally, it keeps working when the internet does not: the dish still reports its status during an outage, which is precisely when a fifteen-second cloud summary has nothing to say. Collected on site, that record survives the outage and tells you afterwards exactly what happened, second by second.
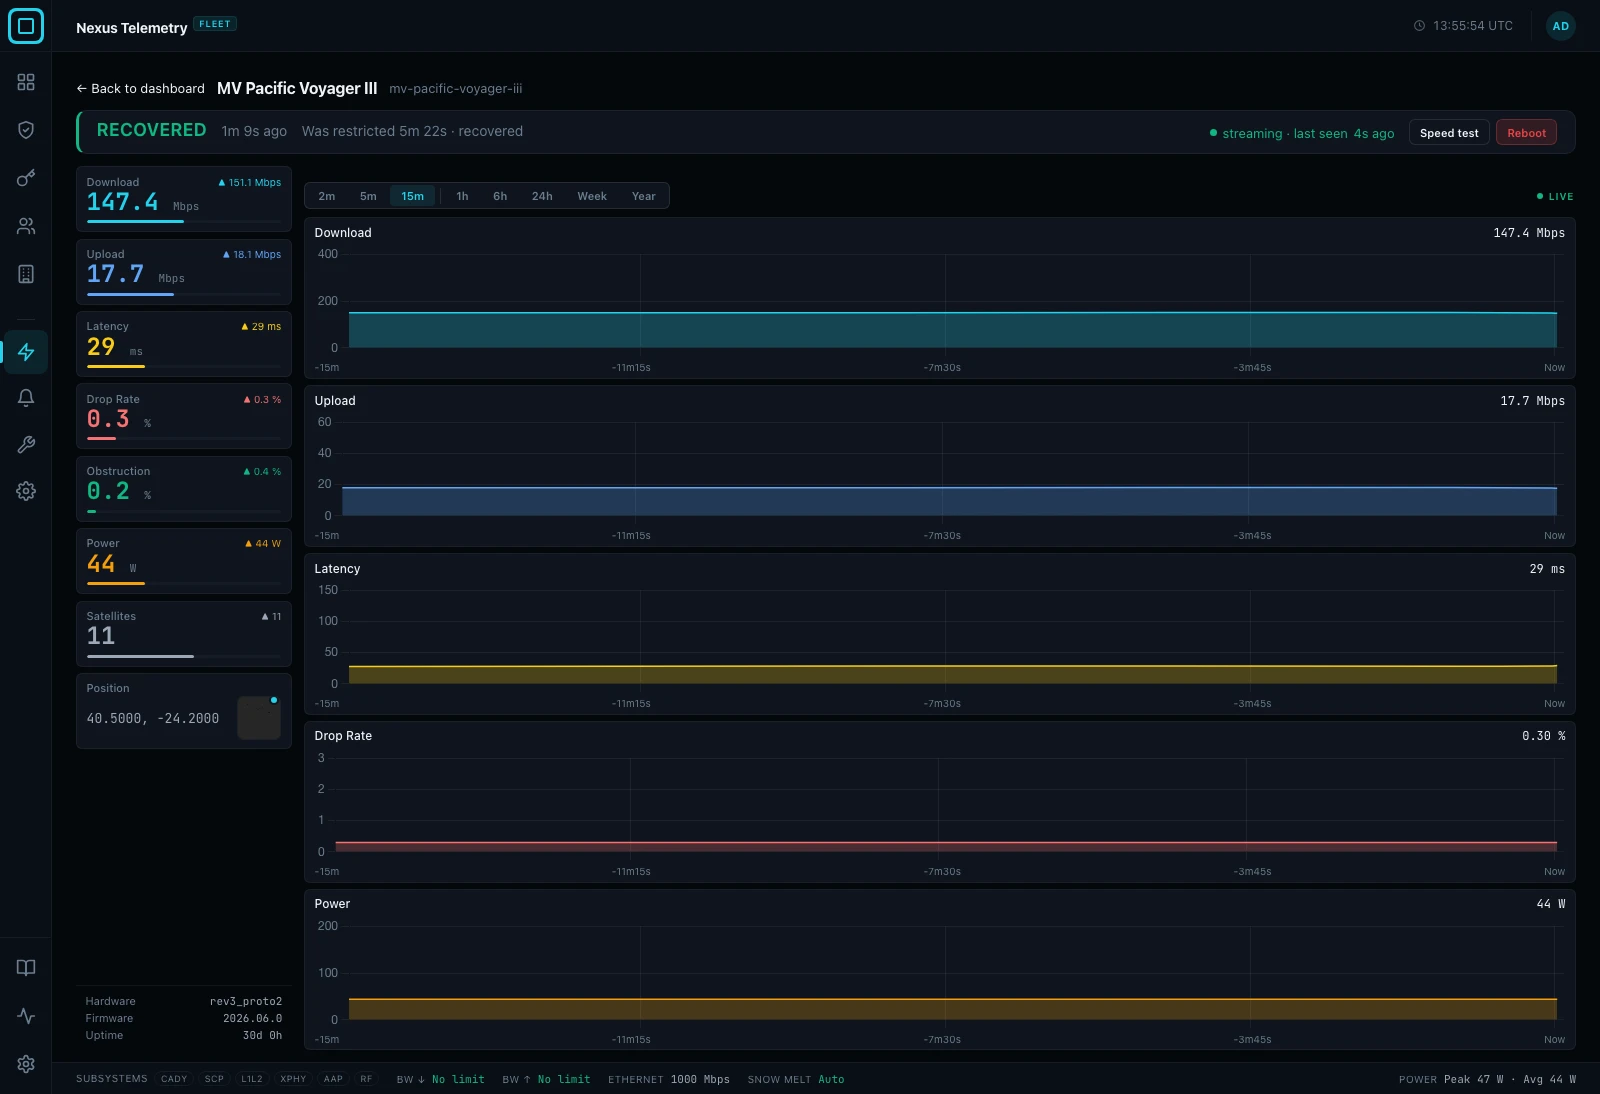
The trade-off is presence: something has to be on the local network to read it. For one dish that is a desktop app. For a fleet it is a small collector at each site, which is the model Nexus Telemetry Fleet is built on: collectors read each terminal directly, dial outbound to your fleet server, and open no inbound port.
When is the Enterprise API the right choice?
When the question is about the account rather than the link. Usage, billing, provisioning, subscription state and fleet-wide inventory are API jobs, full stop. The Telemetry API is also a reasonable fit if fifteen-second summaries of a dozen fields genuinely answer your operational questions and you already run data infrastructure to consume the stream. Plenty of estates fall into that category.
When the question is why a link degraded, what happened during an outage, whether a mount is developing an obstruction, or what the customer actually experienced, the answer is not in the averages. That needs the source.
Do you have to choose?
No, and the strongest setups will not. The natural division is the API for money and metadata, direct telemetry for truth about the link. Nexus Telemetry Enterprise is built for exactly this: account data from Starlink’s Enterprise API integrated with the telemetry Fleet reads directly from each terminal, so one screen answers both kinds of question. The account side is covered in depth in the Starlink Enterprise management guides.
The short version
The Enterprise API gives you account control and a fifteen-second summary of each terminal, documented as such by Starlink, and it is the only source for usage and billing. The terminal gives you everything, every second, locally, including during outages, but something must be there to read it. Summaries for the account, the source for the link, and ideally both in one place.
Part of Starlink Fleet Monitoring: The Complete Guide. Nexus Telemetry Fleet is built by Liquidbinary Ltd, the developers of one of the first Starlink Enterprise management platforms. Fleet is in early access: get started.