Starlink fleet monitoring means watching every terminal you operate, in one place, at the resolution problems actually happen, without depending on anyone else’s cloud to do it. No single Starlink product gives you that today: the app shows one dish at a time, and the Enterprise API reports telemetry aggregated to a fifteen-second cadence. This guide explains what each layer of the ecosystem can genuinely see, what a fleet operator should demand from any Starlink monitoring tool, and where dedicated fleet software fits.
It is written for anyone responsible for more than a couple of terminals: vessel fleets managed from shore, service providers with distributed customer sites, and businesses running Starlink at remote or unattended locations.
Why is fleet monitoring a different problem from monitoring one dish?
Because the job changes from watching to triage. With one dish you look at charts. With thirty terminals across vessels or sites, nobody watches thirty charts: you need the terminals that need attention surfaced automatically, with why and since when, while everything healthy stays quiet. You also lose physical access. Nobody is walking over to a dish that is three hundred miles offshore, so the monitoring has to be unattended, has to survive the very outages it exists to record, and has to distinguish “the terminal was down” from “we simply could not see the terminal”.
What can each layer of the Starlink ecosystem see?
There are three layers, and understanding them is most of the buying decision.
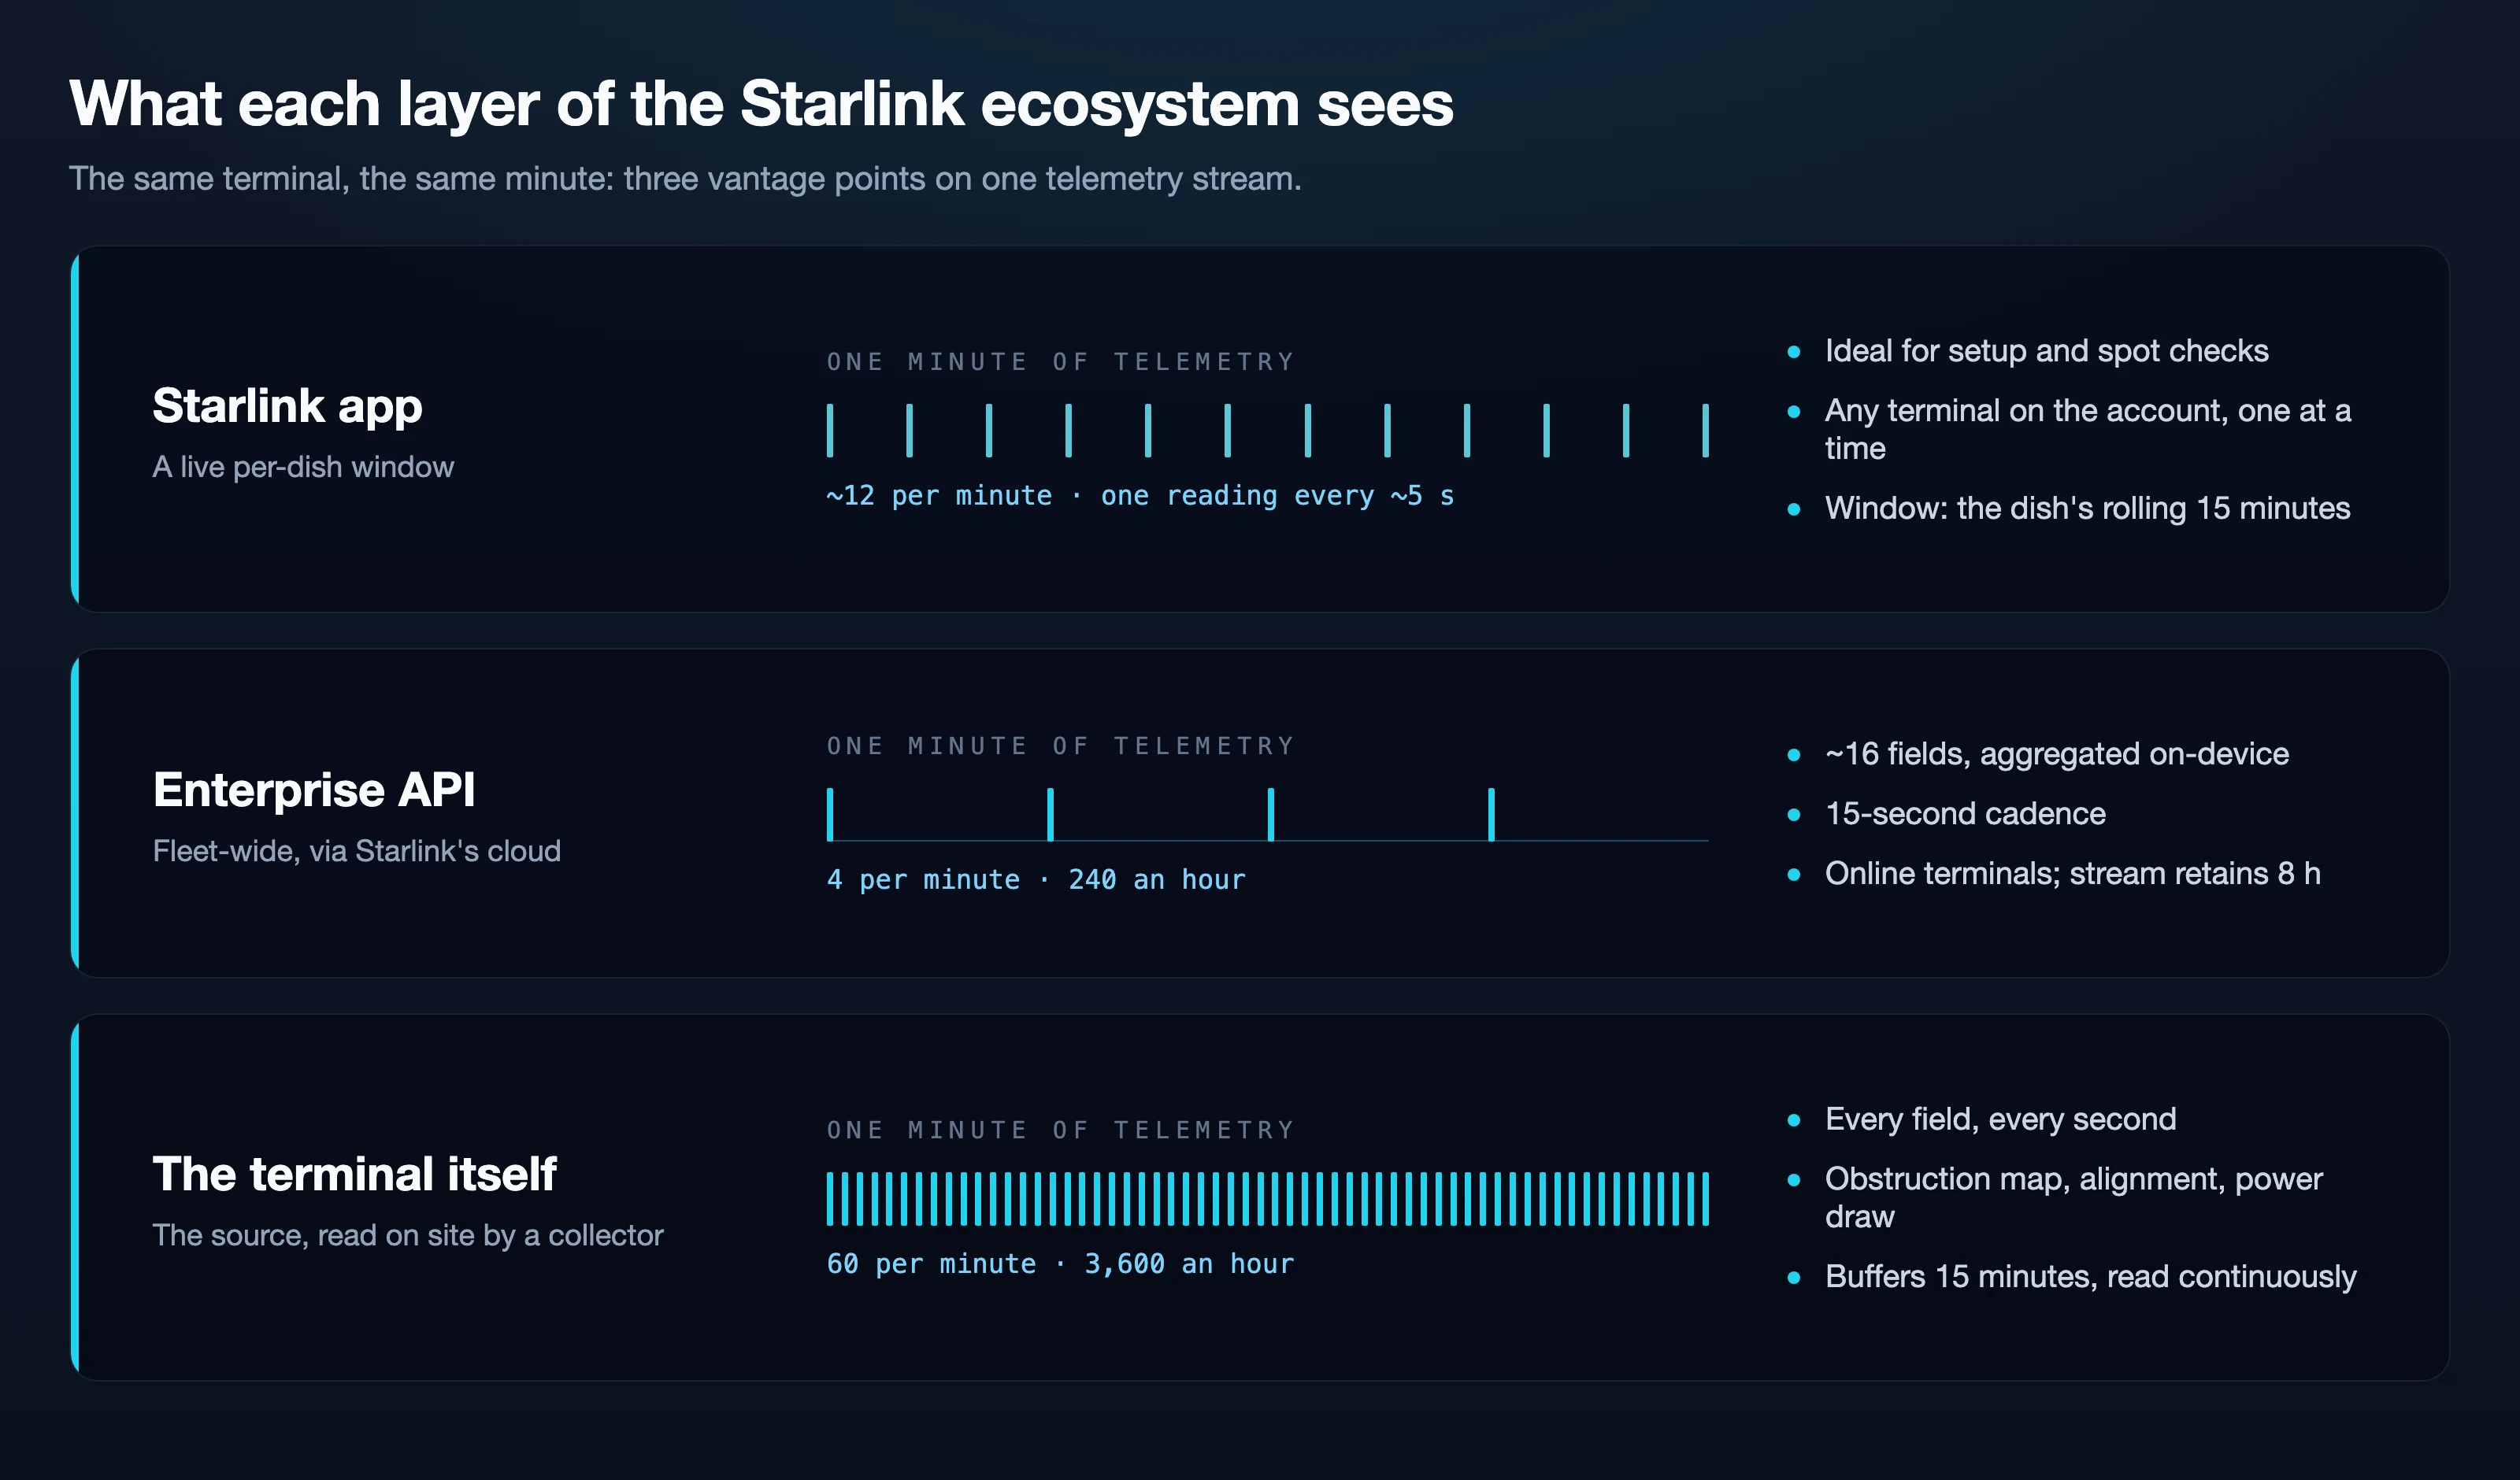
The Starlink app is a per-dish tool. It can open any terminal on the account, one at a time, showing status, a simplified obstruction view and a speed test, with the dish’s rolling fifteen minutes of history. What it lacks is a combined view, so it does not scale past a handful of dishes.
The Starlink Enterprise API is fleet-wide but coarse. Starlink’s own documentation specifies that user terminals and routers aggregate telemetry on a fifteen-second interval before sending it, that consumers poll a stream endpoint for batches, and that data may not be available in every response. The fields are averages: latency, drop rate averaged over the fifteen-second window, throughput, a moving-average obstruction percentage, uptime, a capped signal quality figure, and location as a coarse geospatial cell rather than coordinates.
It is genuinely useful, particularly for usage and billing data, but there is no obstruction map, no alignment, no power draw, no per-second events, and nothing live while the cloud path between you and Starlink is unavailable. We cover this layer in detail, with the documentation to back it, in Enterprise API vs direct telemetry.
The terminal itself broadcasts the full telemetry surface on its own local network, second by second: everything above plus the obstruction map, alignment, power, satellite counts, boot timings and sub-second events. This is the layer the Nexus Telemetry desktop apps read for a single dish. Reading it at fleet scale requires something on each site to collect it, which is exactly what dedicated fleet software does.
Is Starlink fleet management the same as fleet monitoring?
They overlap, and most operators searching for Starlink fleet management need both halves. Management is the account side: service lines, subscriptions, data pools, provisioning and remote reboots, which live in Starlink’s management API and nowhere else, so a fleet operation keeps its Enterprise Account for that regardless of tooling. Monitoring is the operational side: live telemetry, alerting, recorded history and availability reporting for every terminal, and it is where the app and the fifteen-second cloud telemetry run out. This guide covers the monitoring half; the split between the two APIs is laid out in Enterprise API vs direct telemetry. The management half, across every Starlink Enterprise account, is covered in the Starlink Enterprise management guides from Nexus Telemetry Enterprise.
What should you demand from a fleet monitoring tool?
Five tests separate a fleet tool from a wall of dashboards: triage-first views, resolution that matches how outages actually happen, honest three-way availability, no inbound ports at the site, and independence from the vendor cloud. Apply them to whatever you evaluate, ours included.
Triage, not dashboards. The fleet view should show the worst thing first and let healthy terminals fade back. A wall of gauges that all need reading is a single-dish interface multiplied, not a fleet tool. Group summaries should show the worst member’s state, never an average, because an average of one dead terminal and nine healthy ones looks fine.
Resolution that matches reality. Outages at sea are often seconds long and clustered. Fifteen-second averages smooth exactly the detail that distinguishes an obstruction problem from a weather problem from a hardware problem. Ask what resolution the tool actually records at, and where that data comes from.
Honest availability. A terminal that could not be observed is not a terminal that was up. Any tool that reports 100% uptime for a device it lost contact with is guessing in your favour, which becomes your problem the moment a customer disputes it. Availability should split three ways: up, down, and unobserved. We explain why this matters more than it sounds in What does fleet uptime actually mean?
No inbound ports. Vessels and remote sites should not have to open firewall ports to be monitored. Collection equipment should dial outbound to the monitoring server and nothing should need to dial in.
Survives the vendor cloud. If the monitoring depends on Starlink’s cloud, it goes quiet at exactly the moments you most want to be watching: the documentation states the feed carries data from online terminals, so a terminal whose link is down is simply absent for that window, and no per-second record of the outage ever arrives afterwards. Local collection keeps the per-second record through the outage itself and reports it once connectivity returns.
Works for your structure. Service providers need multiple customer organisations kept apart on one system. Operators need roles, so the person who watches is not the person who can delete. Everyone needs alerts that reach email or a webhook without someone staring at a screen.
How does Nexus Telemetry Fleet approach this?
Fleet is built on local collection. A small collector runs unattended at each site or vessel, on hardware you already have, reading the dish directly on its own network. Collectors dial outbound to your fleet server and open no inbound port. The server presents an exception-first dashboard: the terminals that need attention, why, and since when.
Availability reports use the honest three-way split. Alerts go to email or webhooks, multiple organisations run cleanly on one server for providers and resellers, and we run the server for you, or, for air-gapped and sensitive environments, install it on your own servers as a private deployment. An optional onboard status page for crews is on the way, answering the only question they ask: is it my device, the vessel network, or the link?
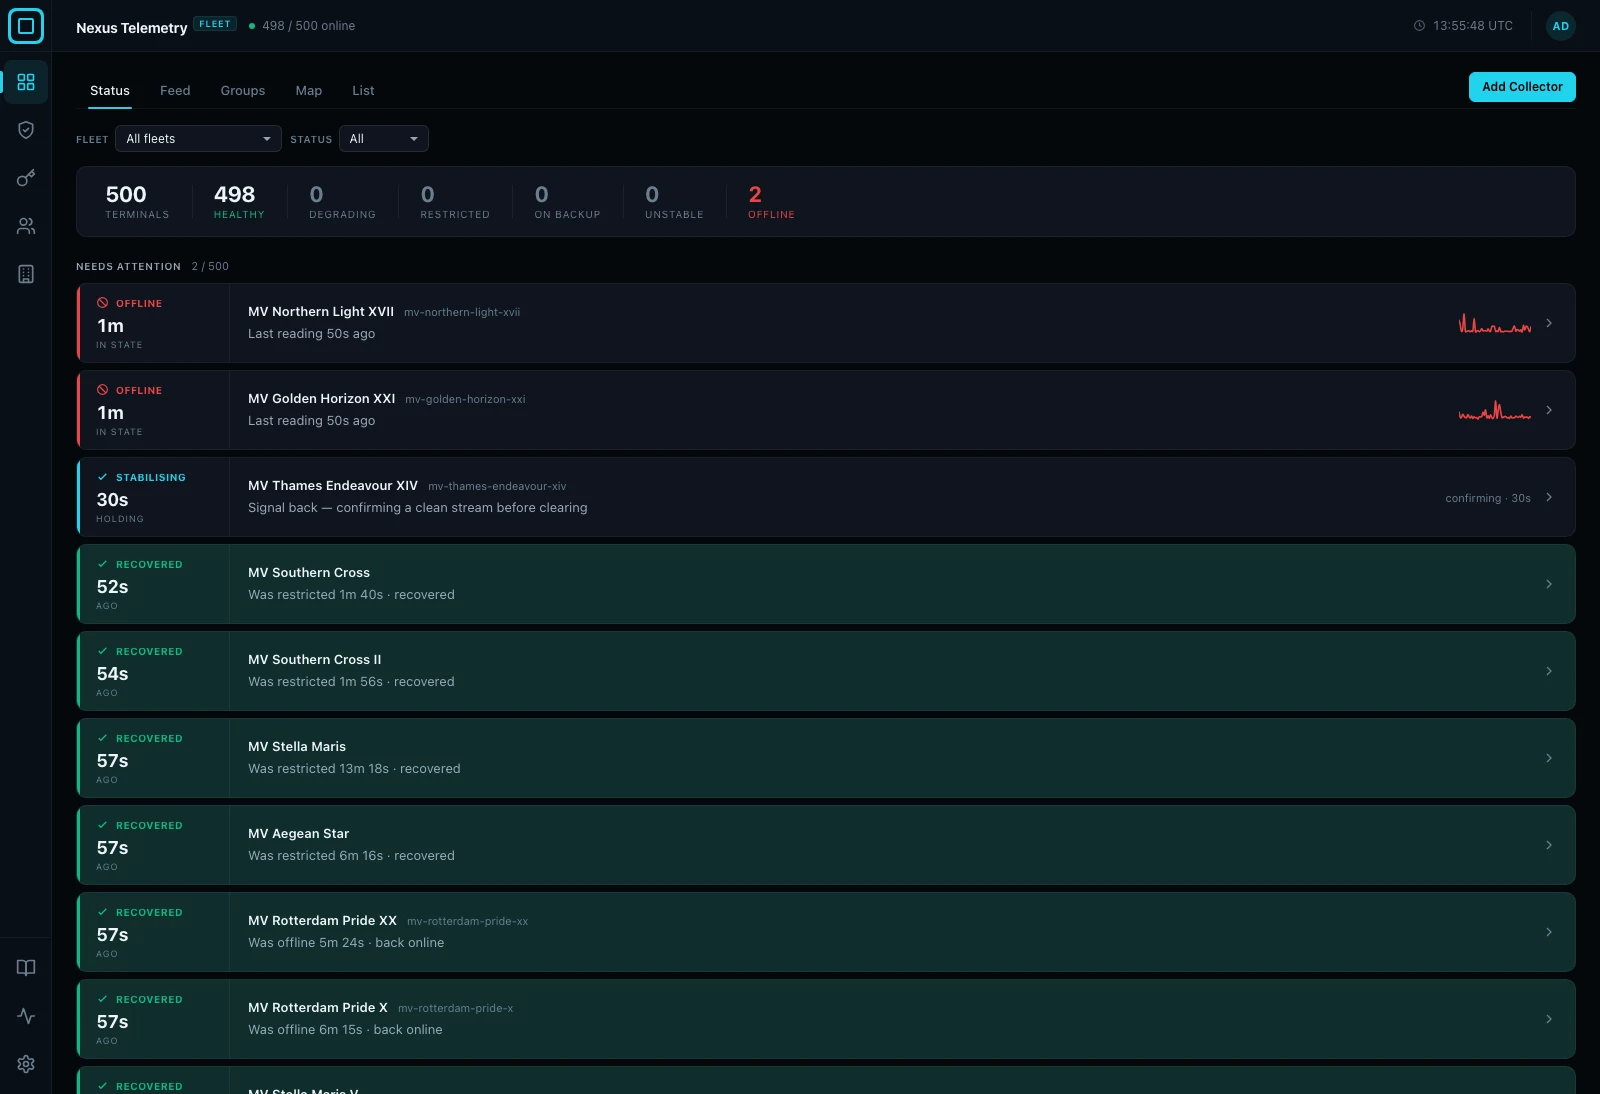
Fleet is in early access, live since 31 August, with general availability targeted for the fourth quarter. If you operate multiple terminals, get started and help shape what ships.
Where do you start?
Ready to run it? The Starlink fleet monitoring documentation takes you from an account to a terminal on the dashboard, with a collector install page for each platform.
If you are evaluating the space, read the Enterprise API comparison first, because the API-versus-local question determines what any tool built on either can ever show you. If you have a fleet problem today, start with how to monitor multiple Starlink dishes, which covers the practical options from free tooling upward. And if you report uptime to customers or management, the availability guide will change what you ask of your reporting.
Nexus Telemetry Fleet is built by Liquidbinary Ltd, the developers of one of the first Starlink Enterprise management platforms, in production across thousands of terminals from 2022 to 2025. Single-dish monitoring lives at nexustelemetry.com.