There are three real routes to watching several Starlink terminals on one screen: the Starlink Enterprise API if you hold an Enterprise Account and can build against it, open-source tooling assembled per site if you are happy running your own stack, or dedicated fleet software that places a small collector at each location and brings everything to one dashboard. The official app can look at any terminal on the account, and for checking one dish it is genuinely good, but it shows one at a time with no combined view, so it is not one of the routes. Here is what each option gives you, what it costs you, and how to choose between them when you are managing multiple Starlinks.
Why doesn’t the official app scale?
It does the one-dish job well, and you can open any terminal on the account. But there is no combined view, no alerting, no recorded history to compare, and nothing you can put in front of a customer or a manager. Somewhere between the second and fifth terminal, checking dishes one at a time stops being monitoring and becomes a chore that quietly stops happening.
Can you use the Starlink Enterprise API?
If you have a Starlink Enterprise Account, yes, with real limits. The API gives you fleet-wide inventory, usage and billing data, and a telemetry stream you poll continuously. The telemetry is genuinely fleet-wide but coarse: Starlink’s documentation specifies that terminals aggregate data on a fifteen-second interval before sending, the fields are a compact set of about a dozen metrics with latency, packet loss and obstruction reported as averages, and the live feed follows the path to Starlink’s cloud.
You also need somewhere to put it, because the API is a stream for your data infrastructure, not a dashboard: consuming it means building and running collection, storage and visualisation yourself.
For usage and account questions it is the only source and well worth having. As the whole answer to monitoring, it tells you a terminal degraded, and an active alert may name the category (thermal, obstruction, a service-state reason) but not with the resolution to reconstruct what happened. The full comparison, with the documentation behind it, is in Enterprise API vs direct telemetry.
Can you build it with open-source tools?
Yes, and technically confident operators have. The established pattern reads each dish’s local interface with community tooling, ships the metrics into a time-series database, and fronts it with a dashboard such as Grafana, typically on a Raspberry Pi or small machine per site. Done well it produces per-second data from the source, which is the right data.
The honest costs: it is a project, per site, that you then maintain through firmware changes that alter what the dish reports. Remote access needs solving safely for every location, which usually means VPNs or opened ports someone must manage. And the pieces that make monitoring operational at fleet scale, triage across sites, alerting, availability reporting you can hand to a customer, multi-user access, are all yours to design and build. For two or three sites run by the person who built it, this route works. Past that, the maintenance tends to outgrow the hobby.
What does dedicated fleet software do differently?
It takes the architecture that works, local collection at every site, and productises the parts the DIY route leaves to you. Nexus Telemetry Fleet is built this way: a small collector runs unattended at each site or vessel, on hardware you already have or as a container, reading the dish directly on its own network at full resolution. Collectors dial outbound to your fleet server and open no inbound port, so nothing at the site needs exposing.
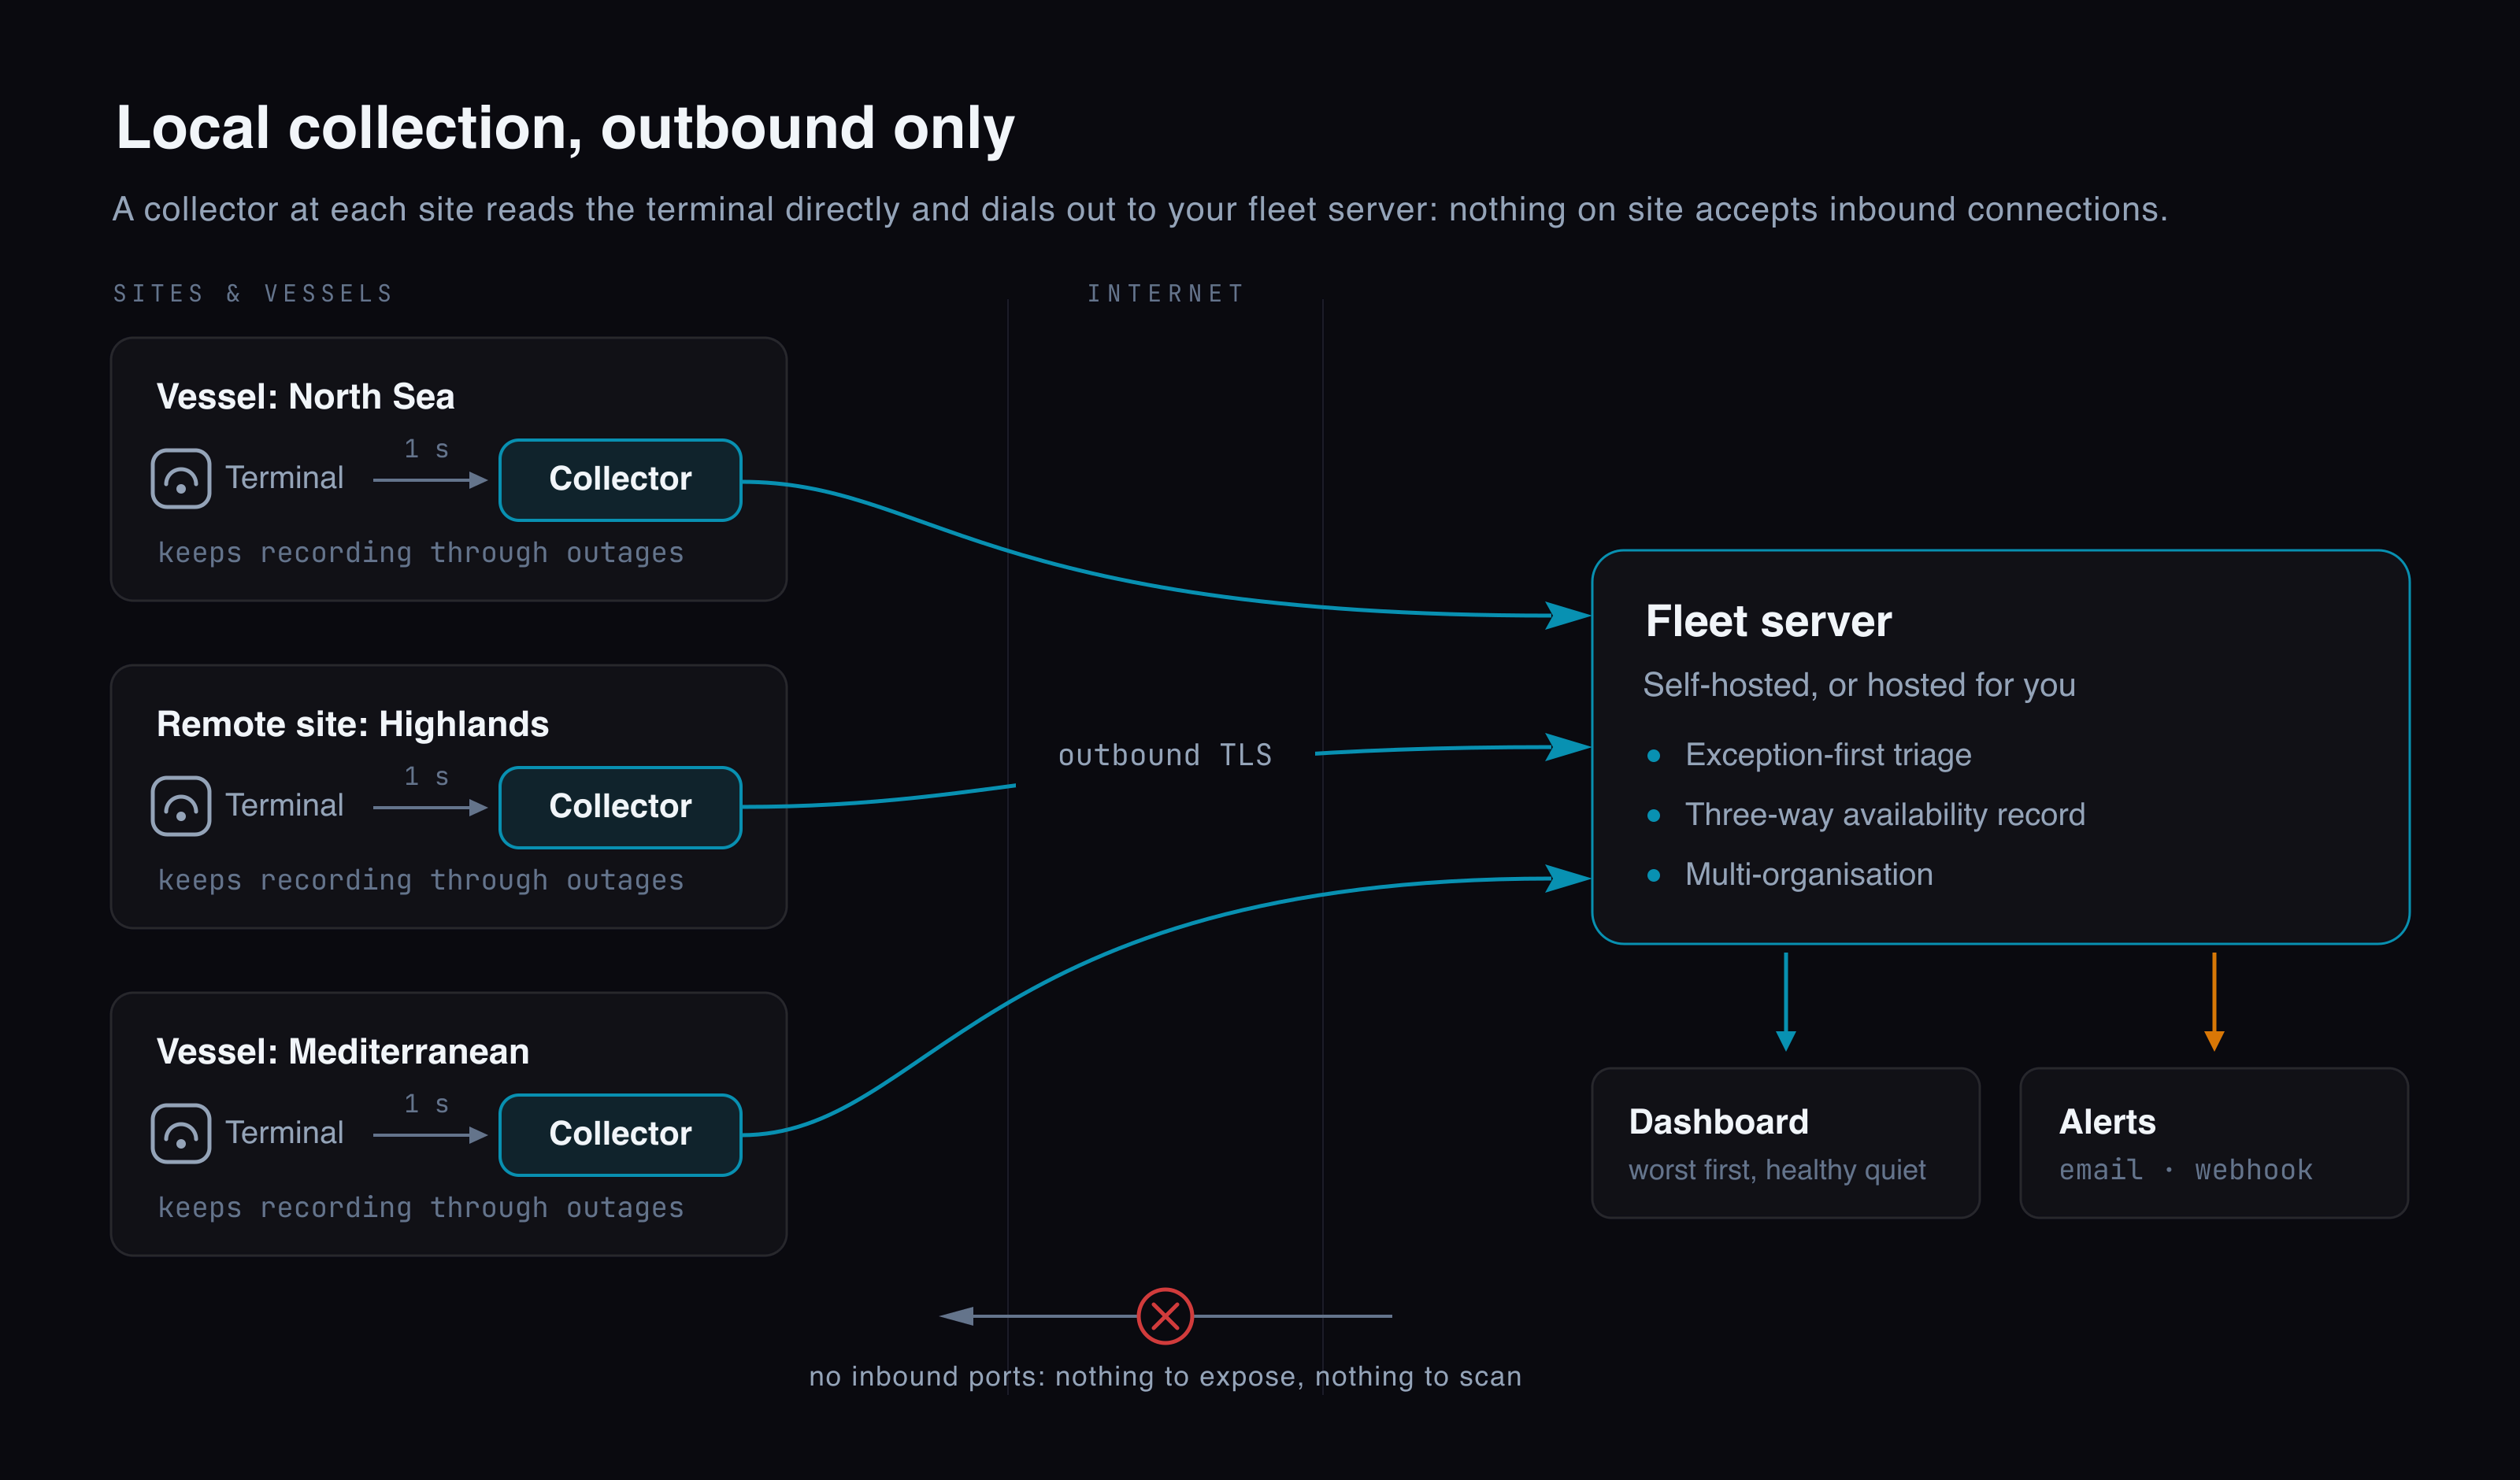
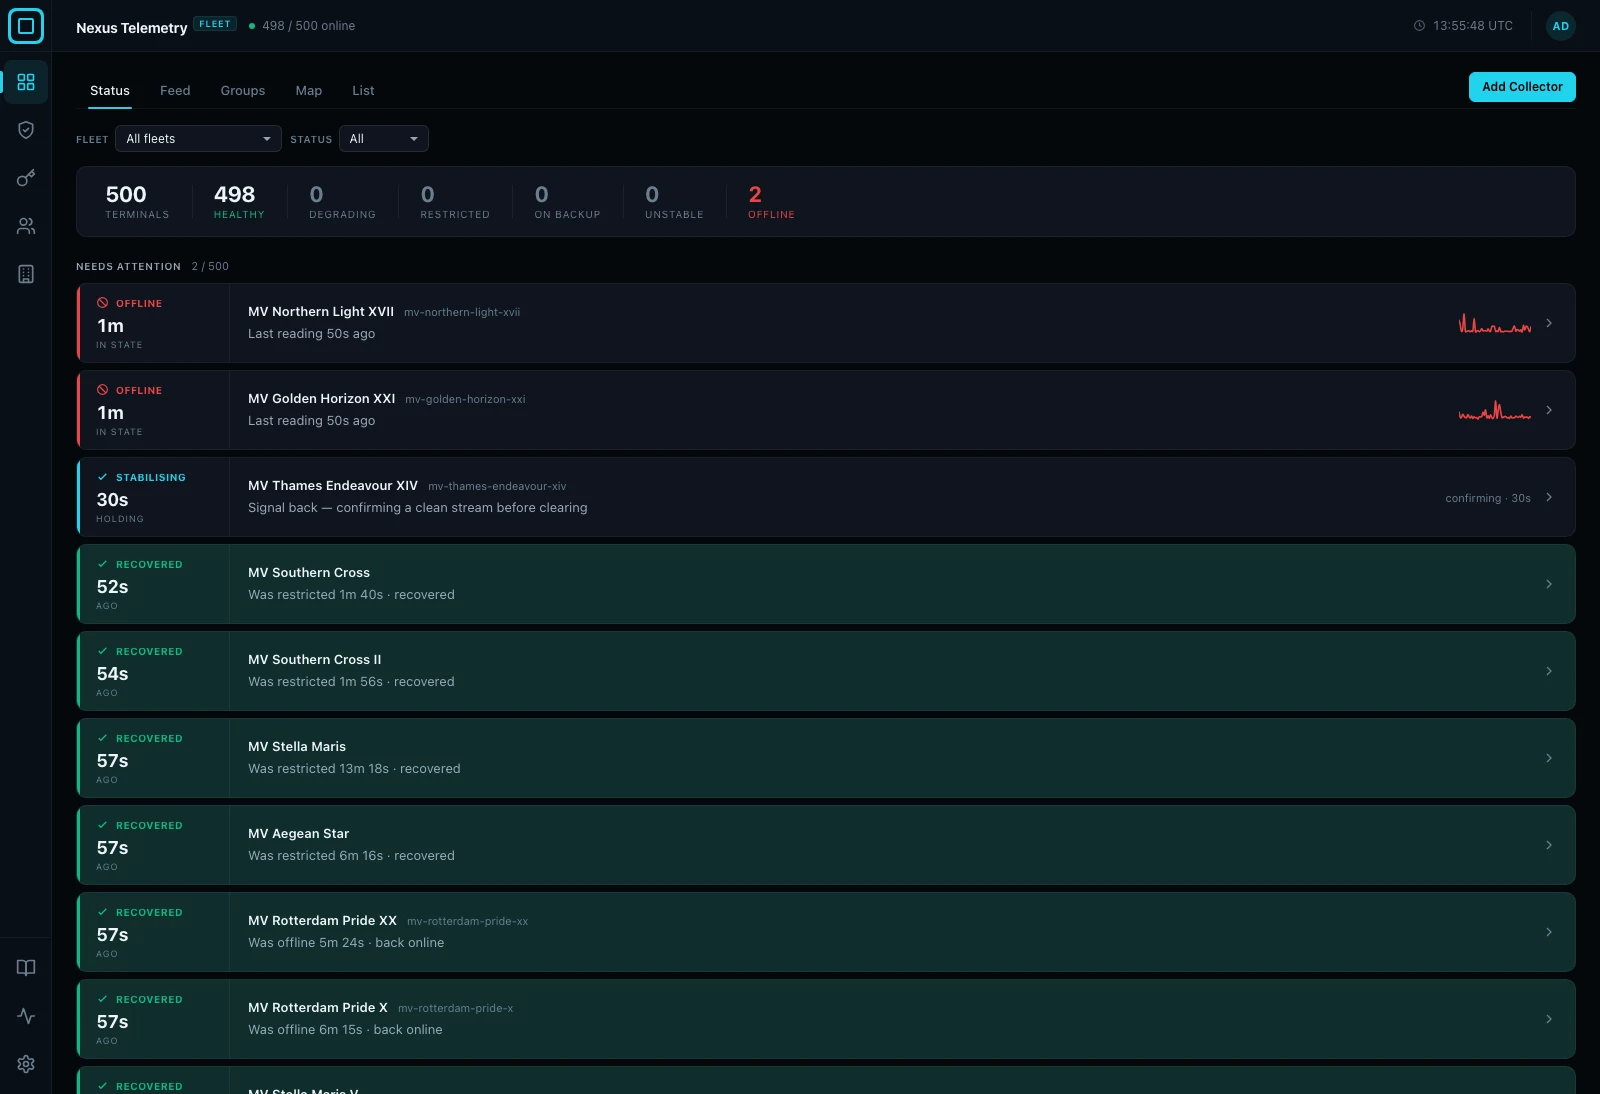
The server presents an exception-first dashboard, worst first, healthy terminals quiet, with alerts to email or webhooks, honest three-way availability reporting, and multiple organisations kept apart on one server for providers managing customers. We run the server for you, or install it on your own servers as a private deployment for air-gapped and sensitive environments, and because collection is local, the record keeps building through the outages a cloud feed goes silent for.
How do you choose?
Match the route to the question you most need answered. If the question is usage and billing across an estate, the Enterprise API answers it and nothing else does. If you have two or three sites, enjoy running infrastructure, and the monitoring is for you, the open-source route is genuinely good. If terminals are on vessels or at unattended sites, if someone else depends on the answer, or if the count is heading past a handful, dedicated fleet software exists precisely because the other two routes run out at that point.
Fleet is in early access now. If this is your problem today, get started and bring your fleet’s requirements with you.
The short version
The app does not scale past one dish. The Enterprise API is fleet-wide but delivers fifteen-second summaries into infrastructure you must build, and it is the right source for usage and billing. Open-source tooling gets full-resolution data at DIY cost per site. Dedicated fleet software puts a collector at each site, reads every dish at the source, and delivers the triage, alerting and honest reporting the other routes leave you to build.
Part of Starlink Fleet Monitoring: The Complete Guide. Nexus Telemetry Fleet is built by Liquidbinary Ltd, the developers of one of the first Starlink Enterprise management platforms. Fleet is in early access: get started.