Live view
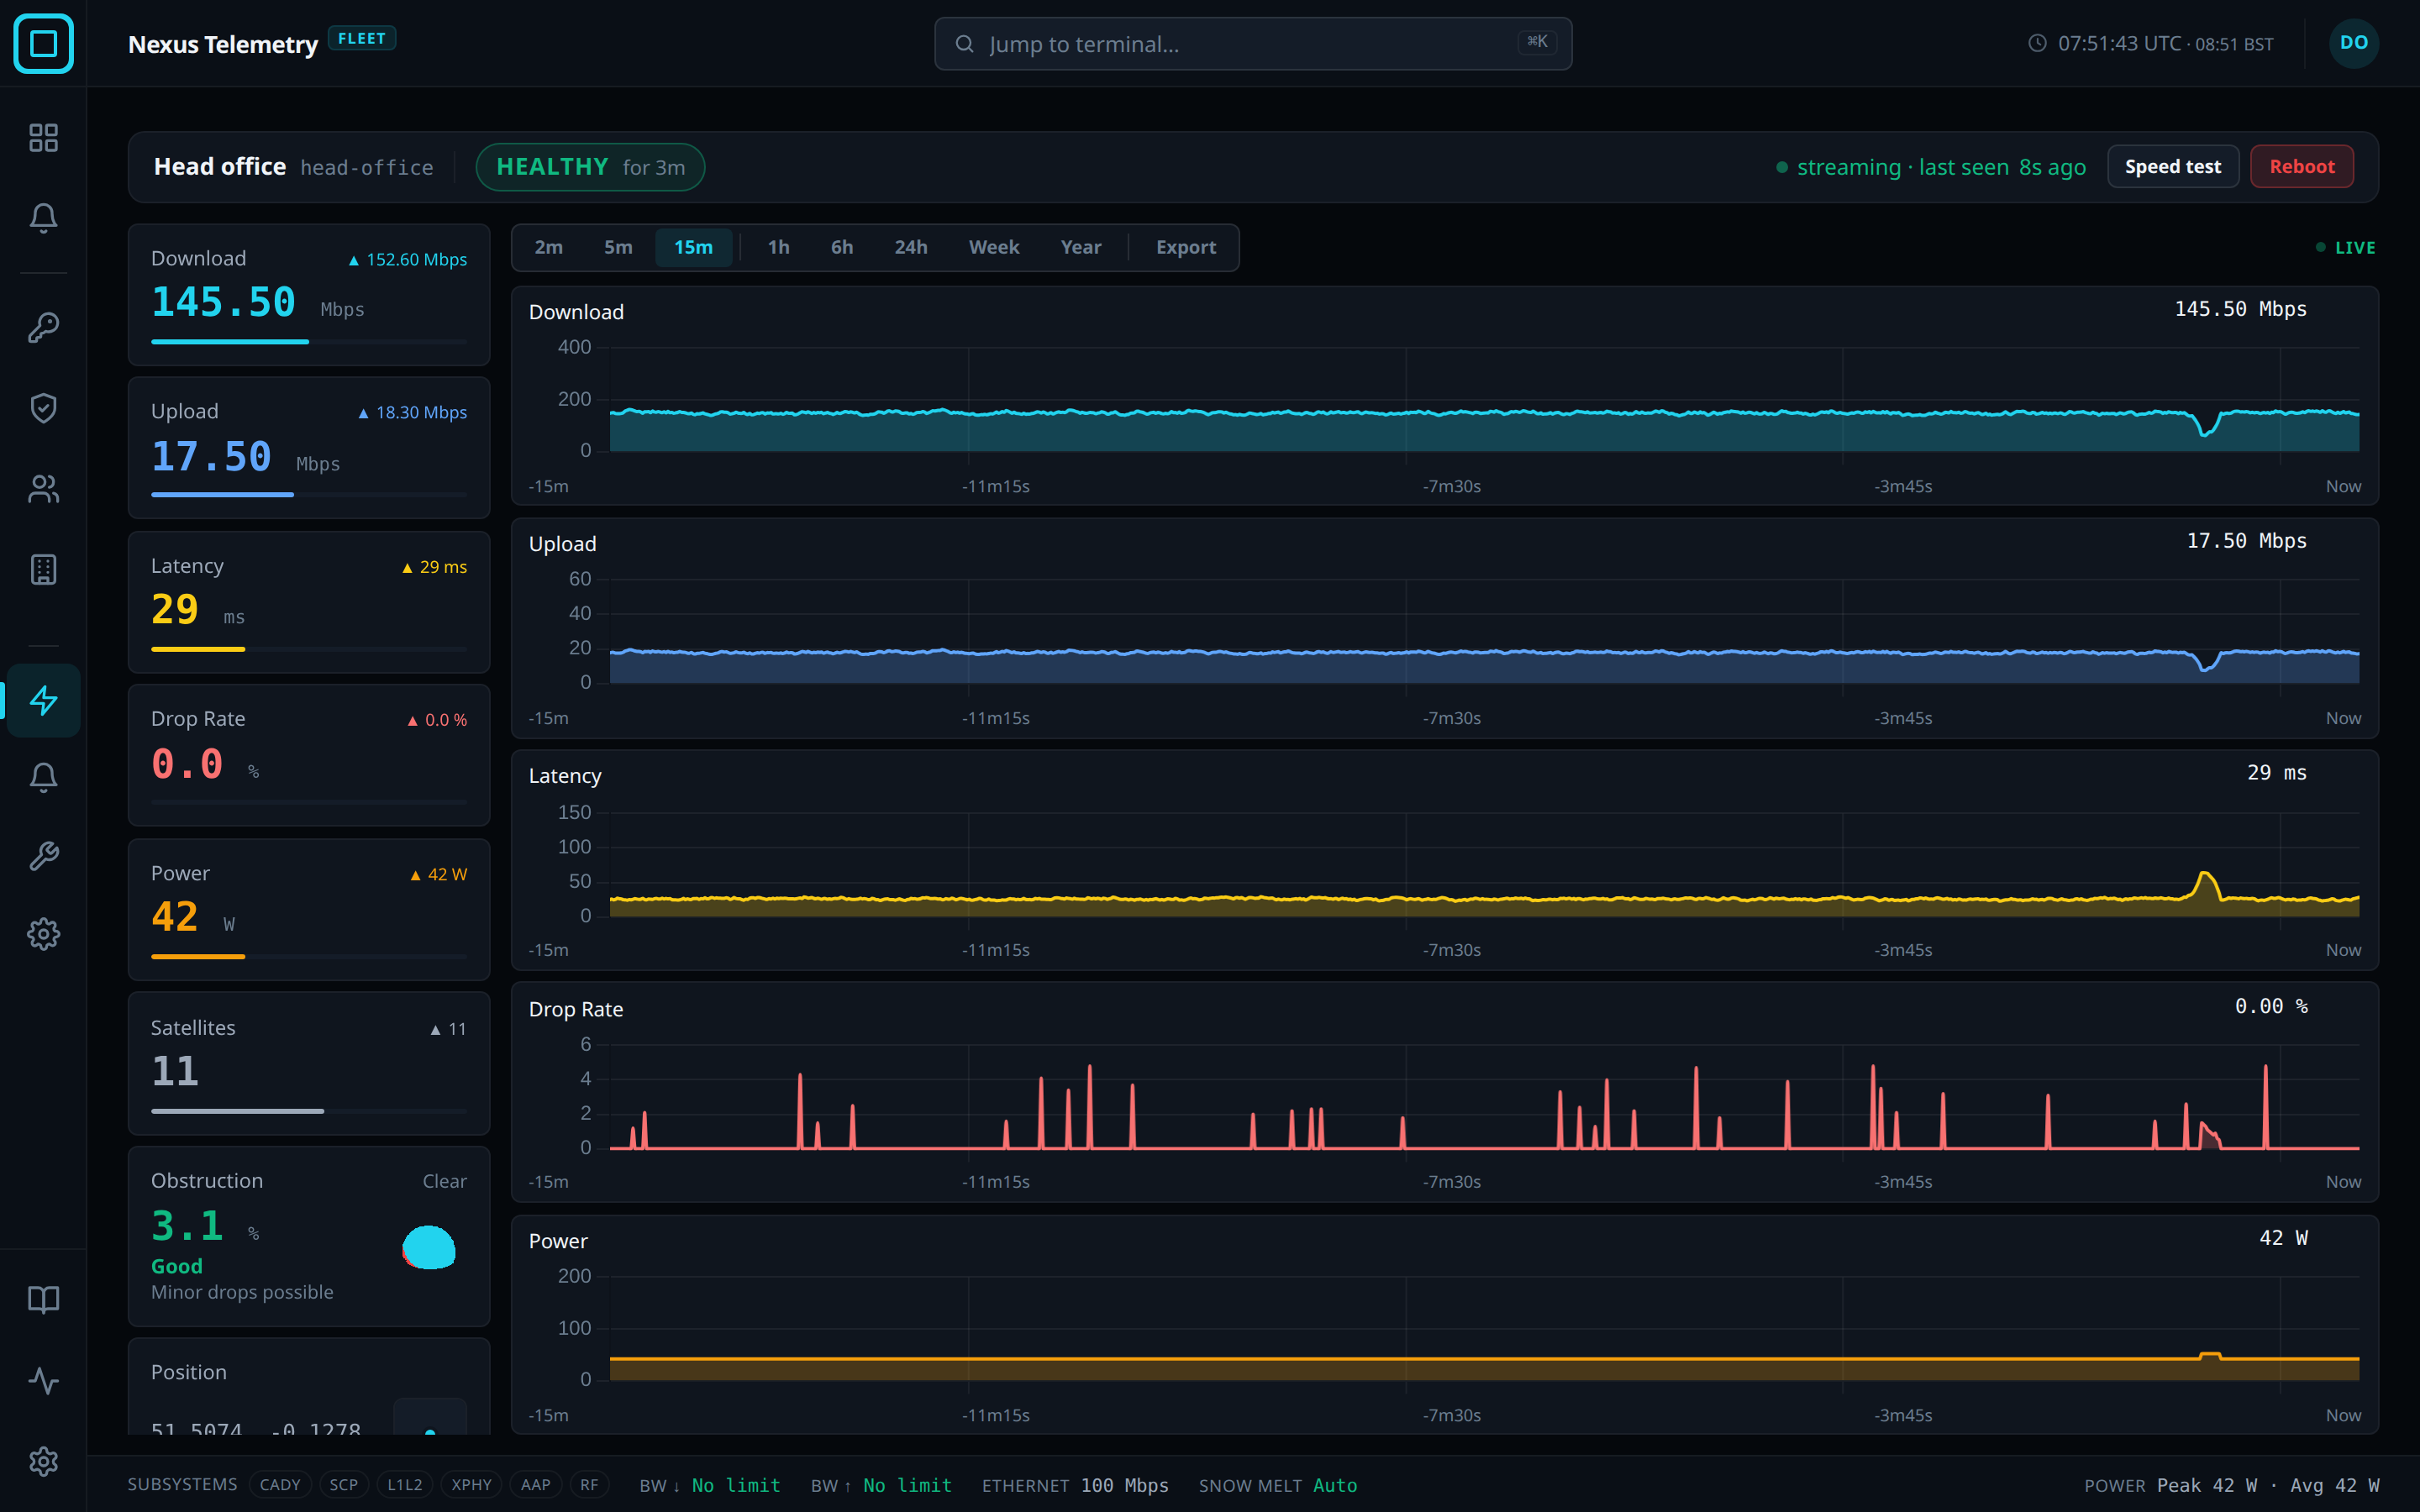
Live is the view of one terminal’s telemetry in Nexus Telemetry Fleet, as the collector at the site sends it. Each terminal has a page in the dashboard, opened with Live view on the terminal’s panel. The page has 5 views, listed in the icon rail on the left while the page is open. Live is the first. See Add a collector for what a collector is.
| View | Shows |
|---|---|
| Live | The terminal’s telemetry now, on this page |
| Obstruction | The sky map, once the terminal has sent one. See Obstruction |
| Alerts | Open alerts, past outages and the event history. See Alerts |
| Diagnostics | Reachability from the collector to the internet, and what the terminal reports about itself. See Diagnostics |
| Admin | The collector’s configuration and the actions on it. See Terminal settings |
Every view but Live shows the terminal’s state, its group, its last reading, its uptime and its collector’s version at the top. The icon rail is the way back to the fleet.
Annunciator
The annunciator is the line at the top that says what the terminal is doing and how recent its last reading is. See States for the state words and the freshness words.
| Item | Shows |
|---|---|
| Name | The terminal’s display name and its hostname |
| State | The state word, and how long the terminal has been in that state |
| Freshness | How recent the last reading is: measuring, streaming, waiting, stale or offline, then last seen with the age of the last reading |
| Maintenance badge | The terminal is in a maintenance window |
| Silenced badge | The terminal’s alerts are silenced |
Instrument cards
There is one card per instrument: Download, Upload, Latency, Drop Rate, Power, Satellites and Obstruction. Every card but Obstruction gives the value now, the highest value in the last 15 minutes, and a bar showing the value against the instrument’s maximum. The Obstruction card gives Clear or Obstructed, the figure with its quality word and what to expect, and the sky disc. An instrument the terminal does not report has an empty card.
Below the instruments, Position gives the terminal’s coordinates and a map thumbnail. A terminal with no position says so, and offers Set a position to a user who can make changes, which opens the Location setting on the Admin view. See Collector GPS. The card’s footer names where the position comes from and its kind: Terminal or GPS receiver with GPS, Collector or Fleet server with Fixed. Hardware, Firmware and Uptime give the terminal’s model, its software version and how long it has been running.
Charts and time range
The charts are download, upload, latency, drop rate and power. Satellites and obstruction have cards and no chart. The time range selects how much history the charts show: 2m, 5m, 15m, 1h, 6h, 24h, Week or Year. It opens on 15m, which is live.
Each chart’s scale starts at zero and is fixed, except that a reading above it extends the axis until that reading leaves the time range.
When 2m, 5m or 15m opens, the fleet server asks the collector for the last 15 minutes of readings at one second. The charts read Loading the last fifteen minutes. until the answer arrives, then add each new reading. A terminal that does not answer within 10 seconds is drawn from the readings received since the page opened. A page left in a background tab can miss readings while the browser slows its timers. The view then asks the collector for the minutes it missed and redraws them.
1h, 6h and 24h are drawn from the collector’s one-second readings, with the average and the full range of each interval. The fleet server asks the collector again once a minute while one of these ranges is open. When the terminal is offline or does not answer within 10 seconds, these ranges are drawn from the five-minute summaries, with the note Drawn from the summaries. The terminal did not answer. A range or span for which the collector holds no readings is also drawn from the summaries, with the note Drawn from the summaries. The terminal holds nothing for this span.
On Week and Year, dragging across a chart redraws that span at 750
points. A span within the last 8 days comes from the collector. An older span
comes from the finest summary that covers it. Back to the week or Back
to the year returns to the full range. The collector keeps its one-second
readings for 7 days by default, set by NF_RING_RETENTION_DAYS.
A stretch with no readings is a gap in the line. A chart drawn from the summaries breaks where two summaries in a row are missing, so a terminal switched off overnight shows each night as a gap on Week. Week and a span over 2 days label each midnight with the day. Hovering a chart wider than a day shows the day with the time.
| Control | Effect |
|---|---|
| Rest the pointer on a chart | Marks that instant on every chart, with the value of every instrument at that instant |
| Expand chart | Opens the chart large, with Current, Min, Max and Average for the time range |
Export
Export, after Year on the time range, writes a span of telemetry to a CSV file.
- Press Export.
- Choose 15m, 1h, 6h, 24h, Week or Year, or set From and To in your own time zone. The range on screen is preselected. 2m and 5m are inside 15m.
- Press Download.
The drawer reads Preparing the file from the terminal’s own readings. while
the terminal answers, then the download starts and the drawer closes. The
file is named
telemetry-<terminal>-<from>-<to>.csv, where <to> is where the data
ends: an hour from 10:00 reads 1000-1100.
| The file | Detail |
|---|---|
| Rows | One per second for a span of 15 minutes or less, otherwise 750 rows. A chosen range ends at the newest reading the terminal holds, so a watched 15m is 900 rows |
| Columns | Each instrument’s average, lowest and highest reading per row, with the time in UTC. No position |
| Source | The terminal’s one-second readings. A terminal that cannot answer, or a span older than the week the collector keeps, is written from the summaries: the drawer stays open, says which of the two it was, and offers that file as a button. A span with nothing kept reads No readings were kept for this span. and offers no file |
| Gaps | The collector reads the terminal once a second while someone watches it, and once every 30 seconds otherwise, so an unwatched span has fewer rows |
| Span | A typed span is trimmed to the last year, up to now |
System bar
The system bar at the foot shows what the terminal reports about itself: Subsystems, the state of each part of the terminal, BW ↓ and BW ↑, the bandwidth limits down and up, Ethernet, the speed of the wired port, Snow melt, the heater’s setting, Auto, On or Off, and Power, with its peak and average. An entry is shown only when the terminal reports it.
Self-test appears only when the terminal reports a failed self-test, with the part it named. The failure also puts a chip beside the terminal’s state. The entry and the chip link to Hardware self-test codes, which gives each code and the action for each result.
Live actions
The two actions are at the right of the annunciator. Users with the Owner, Admin or Operator role can run them. Both are refused while the terminal’s collector is offline. See Users and roles for the roles.
| Action | Effect |
|---|---|
| Speed test | Runs a speed test on the terminal. The test uses the connection’s full bandwidth for about a minute |
| Reboot | Reboots the terminal. The hostname must be typed to confirm |